
Linear Inequalities Worksheet PDF
If you want to solve these graphing linear inequalities worksheet questions, then you have to understand the basics of linear inequalities.
Linear inequalities mean two sides of a linear function/ expression are not equal. These inequalities look like linear equations or two step equations, but the main difference is Inequality symbols. Linear inequalities involve linear functions with inequality symbols.
Inequality symbols – Less than “<“, Less than or equal to “≤”, Greater than “>”, Greater than or equal to “≥” and not equal to “≠”
Linear Equation Examples: 3x +9 = 18, 5y – 10 = 5 and 7a + 8 = 4a + 38
Linear inequalities examples: 6x – 9 > 11 (one variable) and y ≥ -3x + 4 (two variable)
One variable Linear Inequalities
One variable linear inequality just involves single variable. Let’s say it’s “y”. It can be represented as Py + Q > R.
Where, ”P”, ”Q” and ”R” are integers and “y” is a variable. “>” is greater than inequality symbol.
Example: 2y + 4 < 9, let’s decode this one variable linear inequality.
Left side of above example is 2y + 4. This left side is compared with the right side 9 using Less than “<” inequality symbol. At the end of this article, we will share Graphing Linear inequalities Worksheet PDF. You can download these PDF for practice purpose.
Two variables Linear Inequalities
Two variable linear inequality just involves two variables in linear function with inequality symbols.
Let’s say there are two variables “x” and “y.” These two variables linear inequalities can be represented in different forms using different inequality symbols.
- Using greater than symbol: Px + Qy > R. Where, ”P”, ”Q” and ”R” are integers, “x” and “y” are variables.
- Px + Qy < R (using less than symbol).
- Using greater than or equal to symbol: Px + Qy ≥ R.
- Px + Qy ≤ R (Using greater than or equal to symbol).
Download Graphing Linear inequalities worksheet PDF
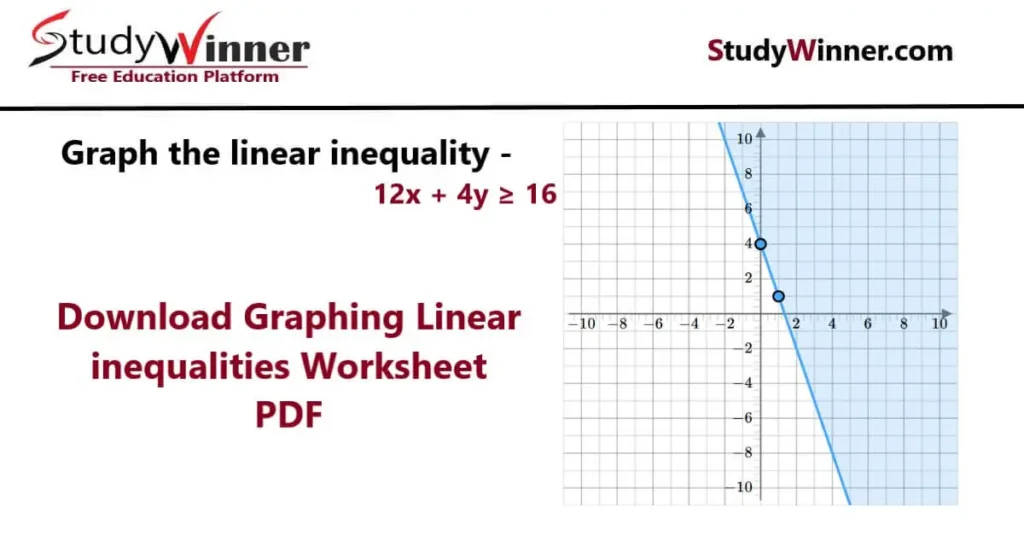
Graphing Linear inequalities: There are mainly two types of linear inequality – One variable and Two or more variables.
Linear inequalities graphing is representation of an inequality on the graph.
You can download Graphing Linear Inequalities Worksheet PDF with answer key from this article.
| Graphing Linear Inequalities by Kuta Software | Download |
| Download Graphing Linear Inequalities Worksheets by mathworksheets4kids.com | Download |
| Cuemath.com Graphing Linear Inequalities Worksheets | Download |
| Edia.app Worksheets | Download |
| Read about Linear inequalities | Read |
FAQs
A. Graphing linear inequalities questions can be solved mainly in 4 steps:
1. Covert to equation.
2. Plot the converted equation.
3. Shade the region based on inequality sign.
4. In last step, we have to identify the required solution area which satisfy the inequality.
A. Firstly, you have to covert linear inequalities into equation. Secondly, we have to plot the graph as per converted equation. Thirdly, Shade the area. Fourthly, we have to identify the required solution area which satisfy the inequality.
A. You have to follow same steps explained in previous questions.
A. Theodore Motzkin
A. Inequality symbols – Less than “<“, Less than or equal to “≤”, Greater than “>”, Greater than or equal to “≥” and not equal to “≠.”
A. Inequality symbols – Less than “<“, Less than or equal to “≤”, Greater than “>”, Greater than or equal to “≥” and not equal to “≠.”